Where is the best place to send your child to school in New York City?
How do you define best? How do you define place? How do you define school?
New York City has the largest system of schools in the United States. New York City’s 5 boroughs are divided into 32 geographical school districts, which have 1,707 schools that serve over 1 million students. Students in grades K-8 are assigned to a zoned school, and students in grades 9-12 have the option of applying to over 400 high schools.
Explore the boroughs, school districts, and schools that meet your criteria. Find your New York City school.


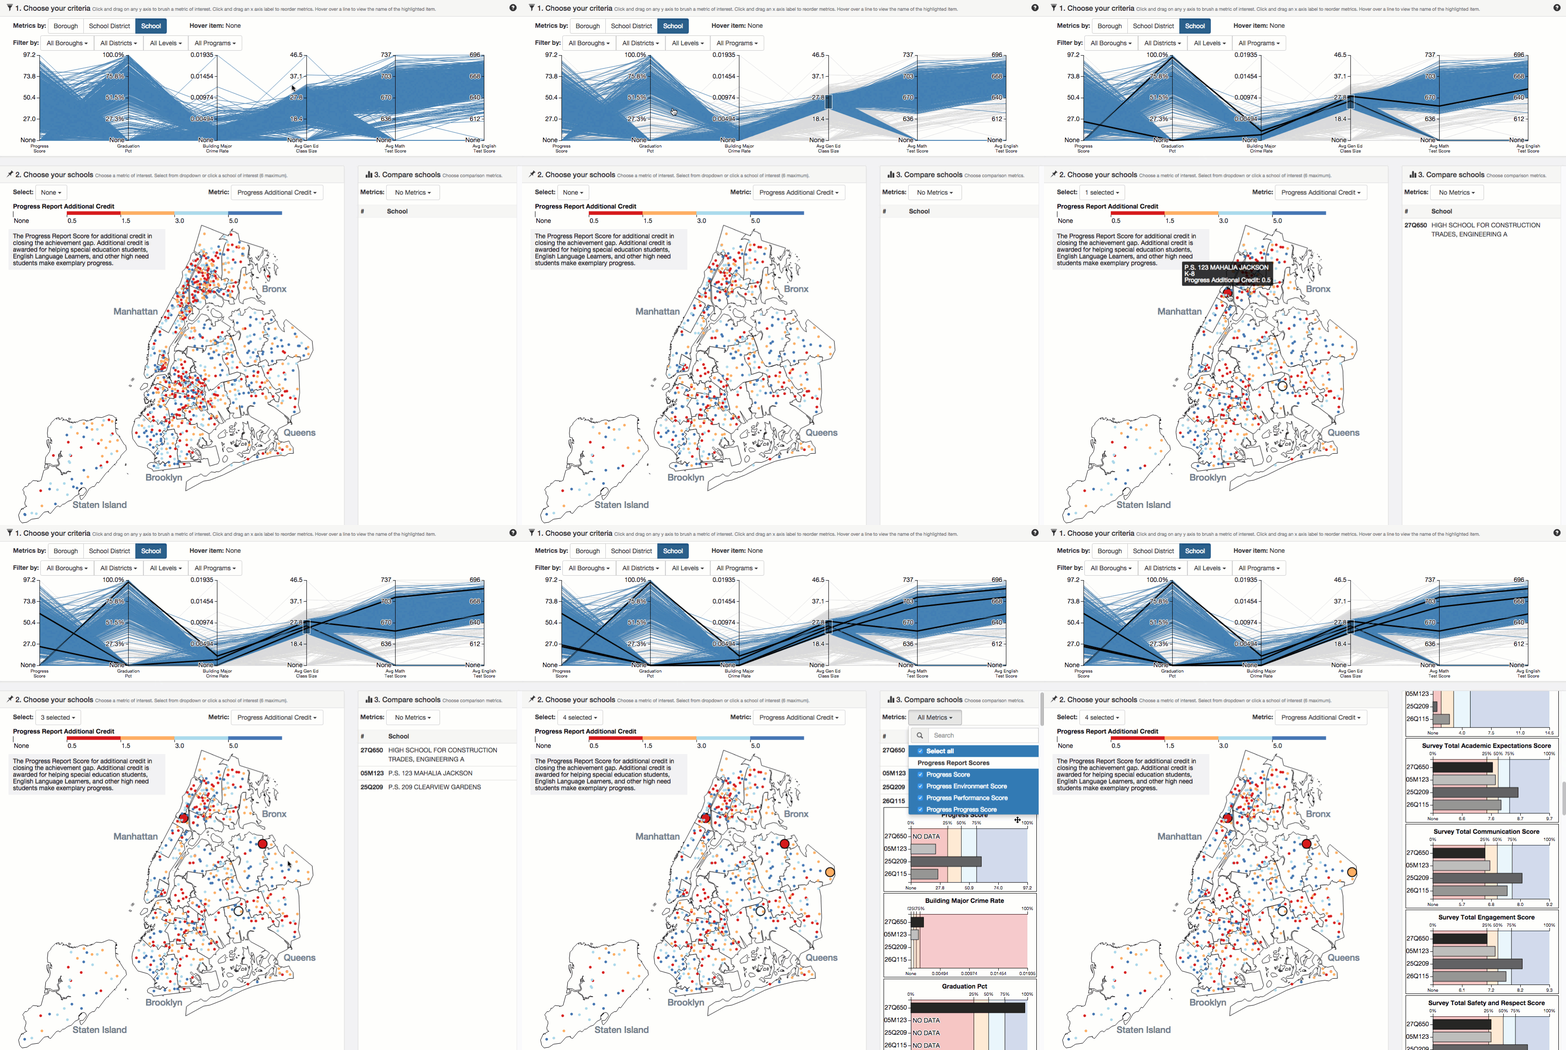
Choose to see metrics for boroughs, school districts, or schools. You can only view metrics for one of these types at a time. Choosing a different metric category will reset all filters and selections.

When the selected metric category is School, there are borough, district, level, and program multiselect filters available. Choosing a borough will filter to only schools in that borough, choosing a district will filter to only schools in that district, choosing a level will filter to only schools at that level (elementary, middle school, high school, etc.), and choosing a program will filter to only high schools with that program (Animal Science, Engineering, etc.). Choosing a different filter will reset all selections.

Click, drag, and let go on any of the y-axes to brush a metric of interest. This will filter the data to only the datapoints within the brushed area. For instance, if you are only interested in boroughs, districts, or schools with graduation rates between 45% and 55%, brush 45-55. Setting or changing a brush will reset all selections.
Click, drag, and let go on any of the x-axis labels to reorder the axes. This will enable you to see relationships between metrics that are next to each other.


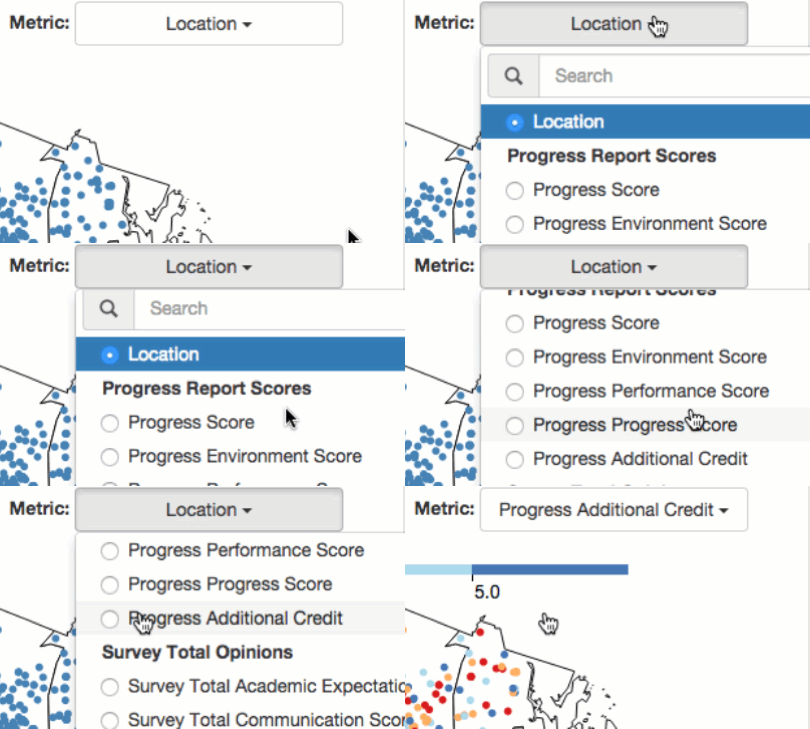
Choose the metric that you would like to see on the map. You can only see one metric on the map at a time.
Filter using the filters and brush technique on the line graph, then select items by clicking the lines in the line graph, clicking the items on the map, or selecting an item from the selection drop down. Once you have the items selected that you wish to compare, choose the comparison metrics to view them side by side across a number of metric categories.


Choose to see metrics for boroughs, school districts, or schools. You can only view metrics for one of these types at a time. Choosing a different metric category will reset all filters and selections.

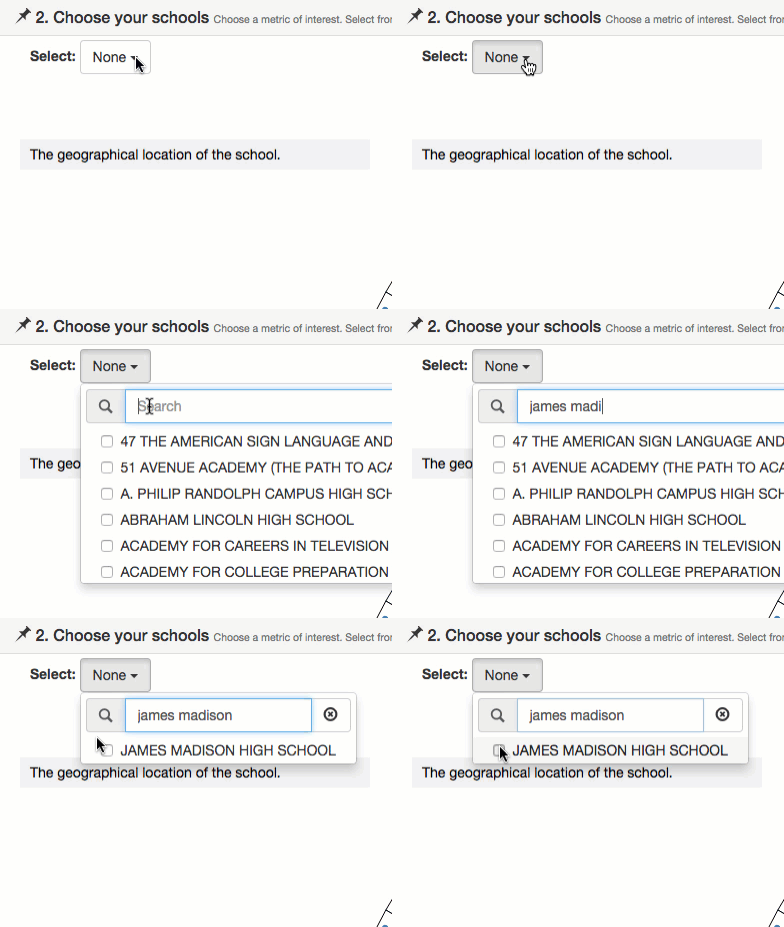
Type in the borough, school district, or school names that you want to compare, and click the checkbox for each item you want to compare.

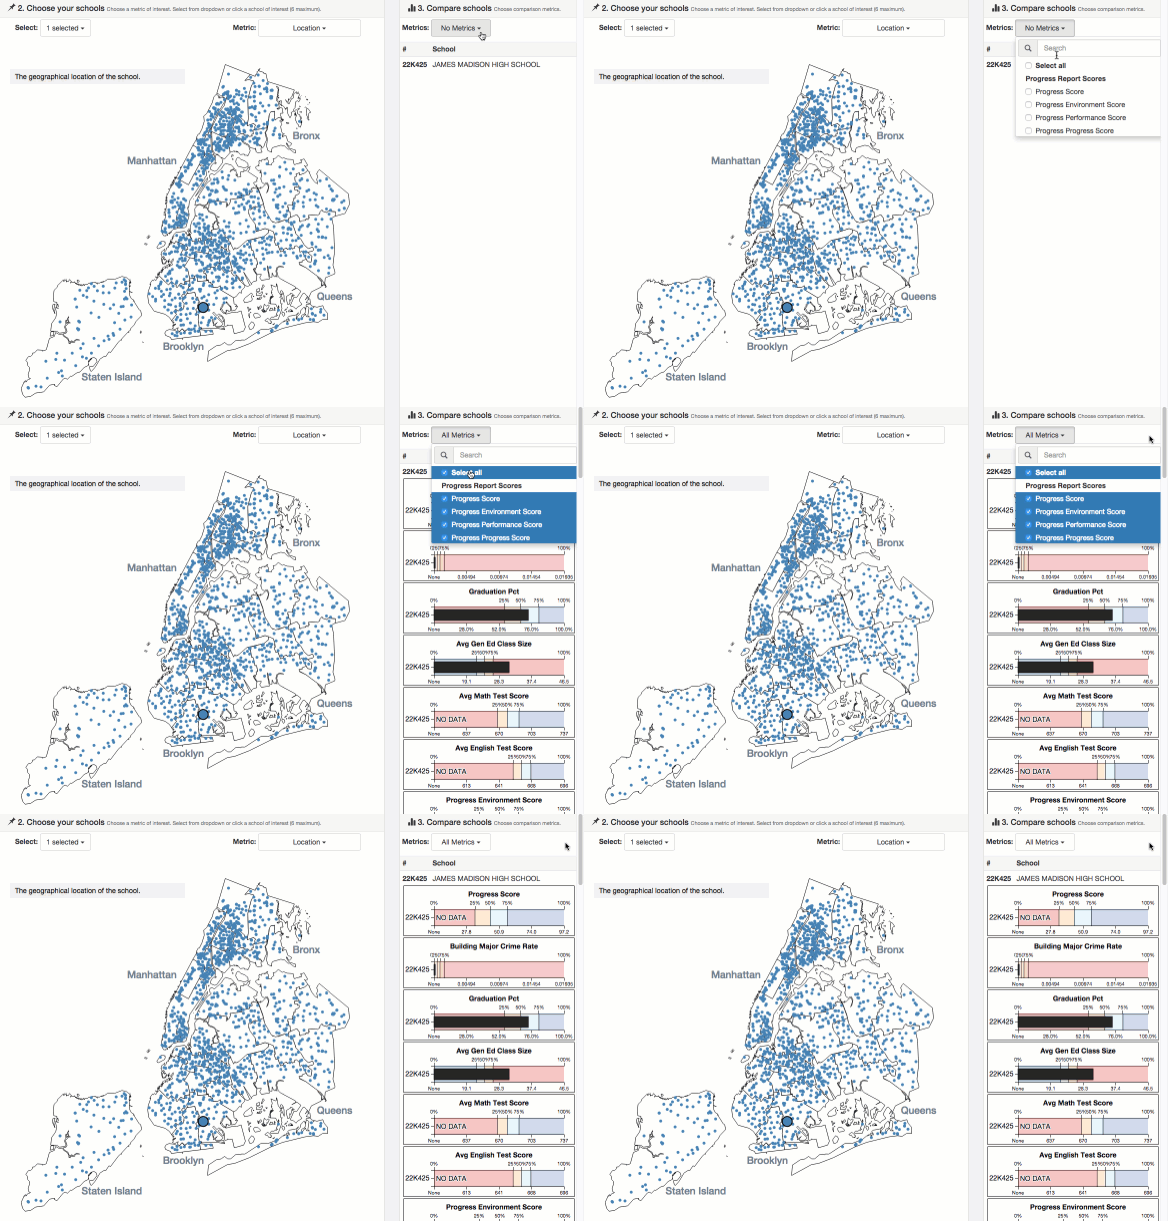
Select all of the metrics you wish to compare.
You can continue selecting items to compare up to six maximum by finding them in the dropdown or clicking the item on the map. You can deselect them by clicking again.
All data for school year 2010-2011.
